Height, weight, temperature, and speed are examples of continuous data. Discrete data examples include, number of shoes you own, the number of cars in a garage, or the number of watches.
Discrete vs Continuous Data: Definition, Differences, Examples, and Uses
Updated on: Nov 07, 2025
Table of Contents
- What is Discrete vs Continuous Data?
- What is the Difference Between Discrete and Continuous Data?
- How Do I Tell If Something is Discrete or Continuous?
- What are Some Examples of Discrete and Continuous Data?
- Real World Uses of Continuous vs Discrete Variables
- Data Visualization: Discrete vs Continuous Variables
- Wrapping Up
- Frequently Asked Questions
If you have started learning about data, you must have come across the terms “discrete” and “continuous” data. But what do they mean? And how can you tell them apart?
As a data analyst, it is essential to understand the type of data you are working with. It helps you choose the right statistical methods and make sense of your results.
I have been working with a large number of data sets for a while. So, I will try to help you break down discrete vs continuous data in the most practical way and explain them with examples and applications.
What is Discrete vs Continuous Data?
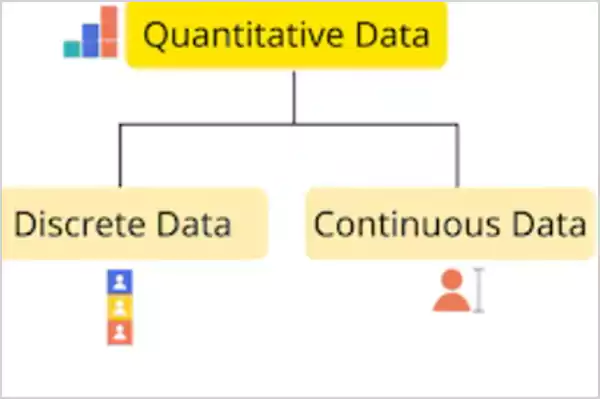
There are broadly two types of data: Quantitative and Qualitative Data. Continuous and discrete data are the two main types of quantitative data. This means they both deal with numbers and measurable quantities. Let’s try to understand both kinds of data in simple terms.
What is Discrete Data?
Discrete data refers to information that can only take specific and fixed values. You can count these values, but you cannot divide them into smaller parts. This data includes only those values that can be counted in whole numbers or integers. For example, you can only count 5 oranges and not 5.4 oranges.
Examples: Number of teachers in a department, number of balls in a basket, number of pets in your home, result of rolling a die, etc.
What is Continuous Data?
In the case of continuous data, the information includes values that can take any number within a range. Unlike discrete variables, these values can be measured and broken down into smaller fractions or decimals. This type of data often changes over time and has an infinite number of potential values between two points.
Examples: A person’s weight or height, temperature throughout the day, time taken to finish a marathon, amount of water in a container, etc.
In short, discrete is countable and fixed, and continuous is measurable and can vary infinitely.
What is the Difference Between Discrete and Continuous Data?
Here’s a simple comparison of continuous vs discrete data to help you quickly identify them:
| Aspect | Discrete Data | Continuous Data |
| Value | Countable and fixed | Measurable, can take any value within a range |
| Type of Numbers | Whole numbers and integers | Fractions, decimals, and percentages |
| Measurement | Counted items (like the number of people or things) | Measured quantities (like width or temperature) |
| Divisibility | Cannot be divided further | Can be divided into smaller parts (infinite value within any two points) |
| Variation | Remains constant over a period | Can change continuously over time (hence the name) |
| Granularity | Less | More |
| Examples | Number of cars, students, or coins | Weight, height, time, speed |
| Representation | Bar graphs, pie charts, etc. | Line graphs, smooth curves, etc. |
| Applications | Education, manufacturing, e-commerce | Finance, environmental studies, marketing, and healthcare |
How Do I Tell If Something is Discrete or Continuous?

So, whenever you are unsure between discrete and continuous variables, just ask a simple question: Can it be counted, or does it need to be measured? If you are still unsure, here are some of the key characteristics of each type to keep in mind:
- Key Signs to Identify Discrete Variables
- Countable and fixed.
- No decimals (you cannot divide a unit).
- Easy to visualize with the help of basic charts.
- Key Signs to Identify Continuous Variable
- Requires a scale or tool to measure.
- Can include decimals, e.g., 40.3 kg, 40.2 degrees Celsius, 9.58 seconds (Yes, Usain Bolt’s 100m record is a continuous variable), etc.
- It can also change over time.
- Usually shown in line graphs to display trends or variation smoothly.
Now, let’s try to visualize something together and understand continuous or discrete with an analogy:
Think of a dripping tap, you can count the drops of water, which makes it discrete. But when the tap is running continuously, you can measure the flow of water in liters, which is an example of a continuous variable.
What are Some Examples of Discrete and Continuous Data?

In the above sections, I have mentioned some examples to compare discrete versus continuous data. They appear in many parts of our lives, from numbers and categories to measurements. Here’s a quick look at some more common examples.
Examples of Discrete Data
- Number of books on a shelf
- Number of students in a class
- Number of cars parked in a lot
- A football team’s wins in a season
- Number of different fruits in the cart
- Days in a year when the temperature crossed 37 degrees Celsius
Examples of Continuous Data
- Heights of building (in meters)
- Volume of fuel in a gas tank (in liters)
- Time taken by an athlete to finish a race (in minutes or seconds)
- Weight of a crate of vegetables (in kilograms)
- Temperature (in Celsius or Fahrenheit)
- Wind Speed (in mph)
- Length of a rope (in inches)
Real World Uses of Continuous vs Discrete Variables
Both data types are used almost everywhere. Understanding how they are used in real-world situations helps us make smarter decisions from data. Let’s compare some key applications of discrete data vs continuous data.
Common Use Case of Discrete Data
- Healthcare: It can be used for counting patients with a specific disease or recording how many people received a vaccine.
- Business: For tracking sales numbers, items in inventory, or total customer orders.
- Education: It is widely used for collecting data-driven insights in education, like counting the number of students, recording attendance, or counting test scores.
It provides clarity when dealing with fixed and separate values. It also helps in reporting the totals, managing resources, and spotting simple patterns.
Common Use Case of Continuous Data
- Healthcare and Medicine: Doctors and scientists rely on continuous data for accuracy. It is used for measuring a patient’s blood pressure, temperature, or heart rate.
- Science and Engineering: This data is essential for experiments and simulations where precision matters the most. It can be used to record the height of a plant, the speed of a vehicle, or the distance traveled.
- Business: Its use can be seen in various business aspects, from analytics to logistics. This includes metrics like time spent on a page, average delivery duration, or overall engagement of the website.
It can help you capture subtle variations and trends, making it important for predictions, research, and performance analysis.
Together, continuous and discrete variables give a complete view of reality. This helps businesses, researchers, and everyday users make accurate and data-driven decisions.
Data Visualization: Discrete vs Continuous Variables
Visualizing data is an important factor of distinction while comparing discrete data versus continuous data. Data visualization makes patterns clearer and easier to understand. The type of chart or visuals you choose depends on the data type.
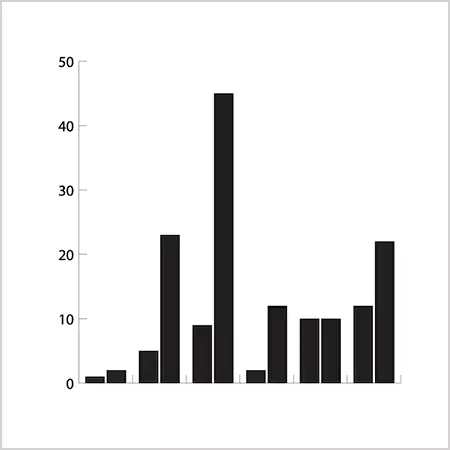
Visualizing discrete data can be best shown through bar graphs (for category or count) and pie charts or mosaic plots (for showing proportion and categories). Each bar or slice shows a clear and countable value, making comparisons easy.
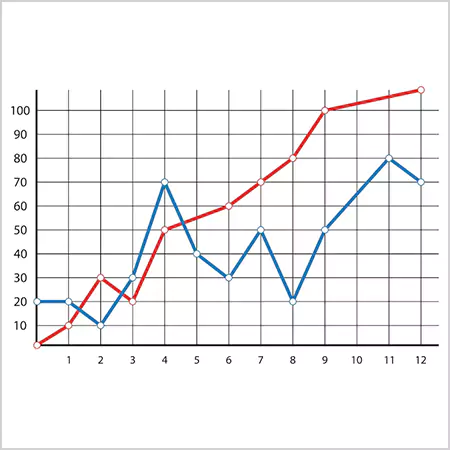
Continuous values are usually shown in histograms (to show ranges or intervals), line graphs (to track trends or changes over time), and frequency polygons (to display smooth and continuous data). Density plots are also used to show data distribution, highlighting peaks and variations.
These visual tools show trends and help spot patterns that numbers alone can’t show effectively.
Wrapping Up
Although I was comparing the two variables, no one is better than the other. Both discrete and continuous data play important roles in research, business, and everyday life.
Everyone is counting and measuring things, and both variables are important to be able to see the full picture. So, just go through the points and tricks I mentioned in this article. And, I am sure that you would be able to see, interpret, and analyze information better.
Frequently Asked Questions
What is an example of discrete and continuous data?
Is salary continuous or discrete?
Usually, your salary has no defined range, which makes it continuous in nature. But a fixed salary of an employee can be used as discrete data.
Is age discrete or continuous?
Usually, we tell our age in whole numbers, which makes it discrete. However, when someone measures age with exact years, months, and days, it should be treated as a continuous variable.
Is Time discrete or continuous?
Time is used as a continuous variable in mathematical models and physics. However, when we measure time at specific moments, it should be treated as discrete.

Related Posts

How to Check for Malware on Mac in 2026?
Can Mac computers get viruses? Macs are not as safe as people think. Yes, macOS has built-in tools like XProtect…
10 Best Lightroom Preset Alternatives in 2026
“Photography is the story I fail to put into words.” — Destin Sparks (Landscape Photographer) For years, Lightroom presets have…
Elementor Hosting vs SiteGround: Which is Faster in 2026?
A website’s performance is mainly determined by its Speed. Even a slight delay can reduce conversions by a significant margin.…
10 Best Visual UGC Platforms for eCommerce Brands in 2026
“People influence people. Nothing influences people more than a recommendation from a trusted friend.” — Mark Zuckerberg (Meta CEO) That…

The Data Models Powering the Next Creative Revolution in Video Generation
Artificial intelligence has evolved from a mere tool to the cornerstone of advancements in the new era. Over the years,…
Solar Software Companies: How Platforms Improve Cross Team Collaboration
“If everyone is moving forward together, then success takes care of itself.” — Henry Ford (Industrialist & Business Magnate) Handoffs…

What Healthcare Leaders Expect From Digital Tools
Healthcare executives are under pressure to protect patient safety, clinician time, and data privacy while modernizing the delivery of care.…

How to Reset Android Phone When Locked? (Safe Factory Reset Methods)
Locked out of your Android phone or stuck on the screen? It happens more than you think. A forgotten PIN,…
How to Transfer Contacts from Android to iPhone: 4 Easy Methods
Switching from Android to iPhone should not feel like rebuilding your life from scratch. Restoring contacts on iPhone should be…