Likert scales, education levels, satisfaction ratings, movie ratings, and income levels are some of the most common ordinal data examples.
What is Ordinal Data? Definition, Uses, Examples, and More
Updated on: Oct 27, 2025
Table of Contents
To understand customer behavior, you need to begin by organizing feedback and ranking opinions, and this is where ordinal data comes into play.
It enables businesses to quantitatively measure aspects such as satisfaction, interest, or preferences, and distill qualitative survey results into actionable insights. In this guide, I will explain the definition of ordinal data in statistics, its differences from other types of data, and provide examples of ordinal data variables.
The guide will also cover the real-life applications of data, common tools to analyze, and how to analyze the data for business or research. So, without further ado, let’s learn!
What is Ordinal Data?
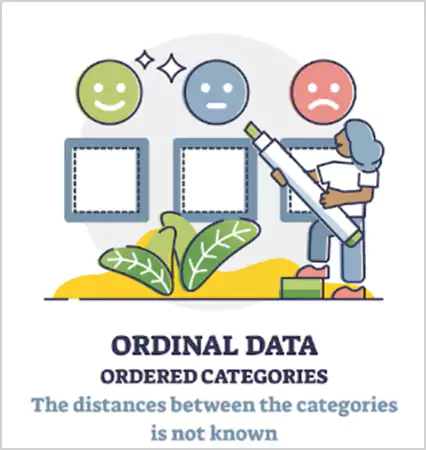
What is ordinal data in simple terms? Well, ordinal data is a form of categorical data that indicates a clear order or ranking among its categories.
It serves to categorize information into levels, which are typically in a logical order (such as low, medium, high, or poor, average, good, excellent). In contrast to numerical data, it does not reveal to us the distance between the categories. It only shows the rank order of the categories.
Let’s understand with an example of ordinal data: If a survey requires people to rate their level of satisfaction, from strongly disagree to strongly agree, the respondent who chose ‘agree’ over ‘neutral’ indicates they are higher on the satisfaction scale. However, it does not indicate the distance between neutral and agree.
In short, you can define ordinal data as a measure to rank and order categories instead of actual values. It is useful as a means to understand preferences, opinions, or positions without requiring precise measurements.
Ordinal Data vs. Other Data Types
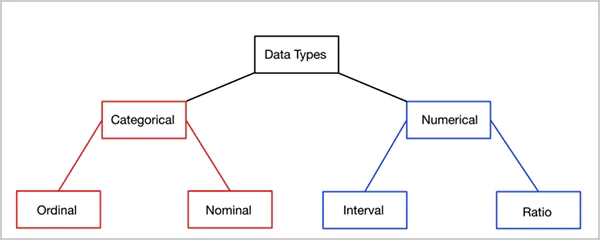
In 1946, psychologist Stanley Stevens first assessed all data types as either nominal, ordinal, interval, or ratio in his article “On the Theory of Scales of Measurement”. It is based on the accuracy of measurement. Let’s take a brief look at how ordinal data fits among others:
1. Nominal Data
Nominal data gives a label to items grouped into multiple categories, but there is no order. For example, red, blue, and green are colors demonstrating nominal data. Other examples of this can be names or zip codes. The label indicates a group of items, but there is no hierarchy.
2. Ordinal Data
This type of data characterizes groups of data in an obvious and ranked order. Categories, like basic, intermediate, and advanced, can be examples of ordinal data in statistics. Rankings exist, but the exact measure of data cannot be determined.
3. Interval Data
Interval data is also numerical, with equal gaps between values, but no true zero point (such as temperature in Celsius or test scores). Therefore, differences from one interval to another can be calculated, but not ratios.
4. Ratio Data
Ratio data has all the features of interval data and also possesses a true zero for meaningful ratios, such as twice as much. The examples of this type of data include height, weight, or income in dollars.
In this classification, ordinal comes second, a more detailed definition of data than nominal, but less precise than interval and ratio data.
What are Some Key Characteristics of Ordinal Data?
Ordinal type is mostly used in areas like market research, psychology, and social studies because it captures opinions, attitudes, and rankings in an organized way. To better understand the ordinal data definition, let’s take a look at its key features:
- Ordered categories: Every category has a clear rank or sequence (e.g., beginner > intermediate > expert).
- Unequal gaps: The difference between ranks is not consistent. For example, the gap between satisfied and very satisfied may not be equivalent to the gap between neutral and satisfied.
- Limited math use: You cannot add, subtract, or average data meaningfully. Instead, you use measures, like median, mode, and frequency.
- Non-numeric by nature: Though numbers can be used as labels (like 1 for poor and 2 for fair), they only represent order and not quantity.
- Useful for analysis: It helps understand trends, preferences, and levels of satisfaction without relying on precise numerical data.
You can think of the ordinal data definition in statistics as a ladder of categories. Each step tells you who stands higher or lower, but not by how much distance.
What are the Examples of Ordinal Data?
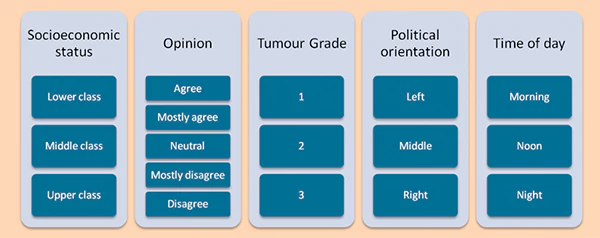
You can find ordinal data examples in many everyday situations where values can be ranked, but the gaps are not equal. Let’s look at a few practical examples:
1. Degree of Interest
When launching a product or testing new features, surveys often use scales, like ‘Not interested’, ‘Somewhat interested’, ‘Neutral’, ‘Interested’, and more. These rankings can help you understand how much your audience cares about your product or idea.
For instance, asking participants how interested they are helps marketers adjust messaging, identify potential users, and plan future campaigns.
2. Level of Education
Education levels such as High School, Bachelor’s, Master’s, or Doctorate are classic ordinal data examples. Recruiters can assign values to these categories to analyze applicant data or identify training needs.
In business, this helps in matching candidates to roles, predicting future hiring needs, or tracking employee development more effectively.
3. Level of Satisfaction
Customer satisfaction surveys often use options such as Extremely dissatisfied, Unsatisfied, Satisfied, and Extremely satisfied. These ordinal data example questions can help track how customers feel about services or products, pinpoint pain points, and improve the overall experience.
For instance, post-support surveys reveal if your team resolved customer issues effectively and how to enhance future interactions.
4. Socio-Economic Status
Terms like Low, Middle, and High income represent ordinal categories. Understanding this data allows data analysts to segment customers by income and personalize their campaigns accordingly.
For example, a B2C company might use income-level data to craft targeted ads, while a B2B company may assess clients based on revenue or company size.
5. Relative Feedback
Another example can be comparative feedback, like ‘Worse than last year’, ‘Same as last year’, or ‘Better than last year’. This kind of running can help you track progress or decline over time. Comparing revenue, engagement, or customer satisfaction between two years can highlight growth opportunities and areas needing attention.
Other common examples can be movie ratings (1-5 stars) and military ranking (Private to General). Each of these examples shows a clear order but not an exact difference.
Practical Applications of Ordinal Data
Ordinal data enables teams to assess opinions, prioritize experiences, and influence strategy in a variety of functions. Here are some of the most common applications:
1. Product and Marketing
Product teams can use ordinal scales to engage with customers in a question such as, “How valuable is our new dashboard?”. The feedback can provide insights into what users deem valuable and, therefore, influence future updates or roadmaps.
2. HR and Employee Engagement
Human Relations teams utilize ordinal survey scores to qualify satisfaction with leadership, organizational culture, and workplace benefits. The data can help uncover engagement drivers and highlight areas for improvement that may lead to higher retention rates.
3. Customer Support
Customer support teams rely on ordinal data example questions. It helps them reveal service quality trends, support and product performance trends, and identify areas that require additional training to better engage customers. In 2025, AI and data analytics can improve your customer service by a huge margin.
4. Research and Strategy
In broader research, e.g., market analysis, psychology, or education, it can help in revealing behavioral patterns, learning outcomes, or identifying shifts in social behaviors.
Overall, you can use this type of data analysis to turn any subjective feedback into actionable insights, and it can be used across all types of industries.
How to Collect Ordinal Categorical Data?
We have witnessed the evolution of data collection from paper forms to AI-supported features. Ordinal data can be collected from surveys, interviews, or other ranking activities. Just keep in mind that the data collection follows a logical and organized order. Here are a few examples:
- Please rank your skill level in AI prompt engineering: Newbie > Beginner > Skilled > Average > Expert.

- To what level do you agree with the new education policy?: Strongly disagree > Disagree > Neutral > Agree > Strongly agree.

You can also collect this type of data through structured observations, like researchers assigning a ranking based on behavior. Plus, pre-existing datasets such as feedback forms, customer databases, or performance reports often contain ordinal information.
Using these methods, you can easily rank preferences and track trends without going through complex measurement processes.
How to Analyze Ordinal Data Statistics?
Ordinal data is most appropriately graphed and analyzed using nonparametric methods, as it does not have fixed intervals. Here’s how you can analyze it using common statistical methods:
- Frequency Distribution: Use bar charts or pie charts to communicate the number of respondents who selected each option.

- Median and Mode: Determine the single most frequently selected response or the most commonly described rank in the response. I would advise you to avoid the mean, as this data is not numeric in nature.

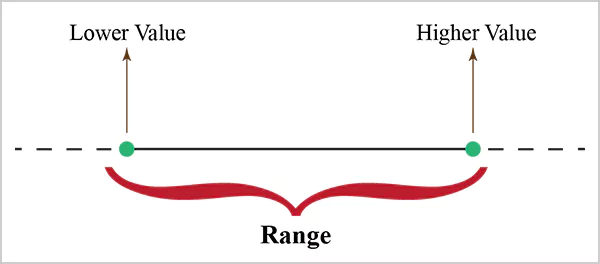
- Range: This communicates the difference between the highest and lowest ranks. However, the range is often limited because the numbers between the ranks are unspecified.
For advanced and comprehensive analysis, you can use the Mann-Whitney U Test or Wilcoxon Test to compare groups while respecting the ordinal nature of the data.
Final Thoughts
In conclusion, ordinal data allows the simple categorization of feedback, preferences, or opinions in a meaningful order, without asking people to provide an absolute number.
It is useful to understand customer satisfaction, making hiring decisions, refining marketing practices, etc. It provides clear direction for better decision-making. In short, it bridges the gap between qualitative opinions and quantitative data and helps organizations make better and more knowledgeable decisions.
Frequently Asked Questions
What is an example of ordinal data?
What is the difference between nominal and ordinal data?
The difference between the two lies in the relationship between categories. Nominal data has no inherent order or ranking (like eye color/film genres). On the other hand, ordinal categories have a meaningful and logical order.
Is age an ordinal data?
Yes, it can be a part of ordinal data when collected in categorized ranges, like ‘18-24’ or ‘24-30’. When the age data is collected as an exact number, it will be considered as a ratio variable.
What are the 4 types of data types?
Nominal, Ordinal, Interval, and Ratio are the four types of data based on the scale of measurement.
Is gender nominal or ordinal?
Gender is nominal in nature because the values, like male, female, or others, have no meaningful order or ranking.

Related Posts

How to Transfer Contacts from Android to iPhone: 4 Easy Methods
Switching from Android to iPhone should not feel like rebuilding your life from scratch. Restoring contacts on iPhone should be…
White Label Ad Server vs Development From Scratch: What to Choose
Even though the DSP segment is the largest market within AdTech at the moment, an ad server remains a crucial…
How Data Infrastructure Powers Next-Gen Mobile Recognition Apps
Modern digital applications have evolved with time, offering various functionalities to users that weren’t possible or even imaginable before. But…
How Poor Contract Visibility Leads to Revenue Leakage in Growing Companies
Growth is an important factor that determines the success rate of any business. When we witness new operations, partnerships and…

Managing Bitcoin Operations? Here’s How Salesforce Automation Helps
“Digital currency is here to stay, and it’s only a matter of how long before governments embrace it.” — Brad…

Why Modern Organizations Depend on Data Privacy Software
Data growth has significantly accelerated beyond what most compliance teams can manage, with personal records, financial details, contracts, and emails…

Converting Chats Into Leads While Maintaining Professionalism
The way marketing teams and businesses approach their potential clients to boost their sales has completely transformed in the last…
How to Delete iCloud Account? Complete Guide for 2026
Thinking, how can I delete iCloud or Apple account? It is not just about removing an account; it is about…

How Different Industries Use Specialized Software to Stay Competitive
In the market we have today, companies are always trying to find ways to work better and get results. The…