Description of an object or its color, personal attributes, emotions, behavior, opinions, likes, dislikes, and experiences are some examples of qualitative data.
What is Qualitative Data? Definition, Types, Examples, and Analysis
Updated on: Oct 30, 2025
Table of Contents
- What is Qualitative Data?
- What are the Key Characteristics of Qualitative Data?
- Qualitative vs Quantitative Data: What’s the Difference?
- What are Some Examples of Qualitative Data?
- Different Types of Qualitative Data
- Common Qualitative Data Collection Methods
- How to Do Data Analysis in Qualitative Studies?
- What are the Pros and Cons of Qualitative Data?
- Tips for Effectively Analyzing Qualitative Data
- Final Words
- Frequently Asked Questions
Let’s start with a quick question: Which of the following is an example of qualitative data?
- Tan leather shoes are considered more cool and attractive.
- As of 2025, most 18 to 26-year-olds prefer vegan leather.
- The Italian businessman wore a beige suede tuxedo.
Most of you will be able to guess it correctly by applying reasoning and logic. Qualitative variables are descriptive and non-numerical in nature, like observational notes, experience, and opinions.
In this guide, I will define the term “Qualitative data” in depth. I will explain its types, the importance of identifying data types, characteristics, analysis techniques, applications, examples, and more.
What is Qualitative Data?

Qualitative data can be defined as any information that tells us about qualities, experiences, characteristics, etc. It does not focus on measuring or counting things; it focuses on understanding the why and how.
Unlike quantitative data that measures ‘how much’ or ‘how often’, qualitative data allows researchers to find out what people think, feel, and value. By exploring this information as a data analyst, you can add depth and meaning to the research by identifying motivations and emotions that numbers alone can’t explain.
If I can explain qualitative data analysis in simple terms, this data helps researchers to identify patterns and themes that offer useful insights to make more informed decisions, better products, and stronger strategies.
What are the Key Characteristics of Qualitative Data?
This type of data can capture human depth and diversity. To understand it in a better way, let’s take a look at its key features, or the 5 facts about qualitative data:
- Descriptive: This type of data describes things or findings through words or visuals.
- Detailed: It offers data in depth and context to show the complete picture behind an experience.
- Open-Ended: It provides room for varied responses and unexpected insights.
- Subjective: It is subjective in nature and is often influenced by personal opinions, feelings, and perspectives.
- Non-Numerical: Instead of numbers, it is presented in words, photos, sounds, symbols, and other non-numeric forms.
Let’s take an example of qualitative data. In a study about workplace satisfaction, participants described their job as rewarding, demanding, or supportive. The expressions provide us with more useful information that cannot be expressed in terms of quantity.
Qualitative vs Quantitative Data: What’s the Difference?

Qualitative data and quantitative data are both essential for a complete and reliable data analysis. One can only get a complete picture for research and decision-making by taking both into account. A quantitative study informs you what is happening, while a qualitative study tells you why it is happening.
Let’s compare quantitative data vs qualitative data in different aspects to understand the difference:
| Aspect | Qualitative Data | Quantitative Data |
| Focus | Quality and meaning | Quantity and measurement |
| Features | Descriptive, emotional, subjective | Numerical, objective, measurable |
| Purpose | Explains why or how something happens | Shows how much, how often, or how many of something happened |
| Examples | 1. What do you do for a living? 2. Are you a full-time employee? | 1. How much do you earn? 2. How many hours do you work? |
| Methods | Interviews, focus groups, observations, etc. | Experiments, surveys, statistics, etc. |
| Analysis | Grouped into themes or patterns | Processed through formulas and data models |
| Output | Words, visuals, and insights | Numbers, graphs, and metrics. |
What are Some Examples of Qualitative Data?
You can easily see qualitative data examples in various everyday contexts, from personal communication to social research. Let’s take a look at some of the examples:
| Categories | Qualitative Data Examples |
| Description (Used to express qualities or sensory details) |
|
| Research and Surveys (Open-ended questions to understand behavior or reasoning) |
|
| Workplace or Professional Settings (Opinions and observations shared in professional settings) |
|
| Miscellaneous |
|
These examples show that the qualitative data is all around us. It is present in the feedback we share, the words we use, and the stories we tell.
Different Types of Qualitative Data
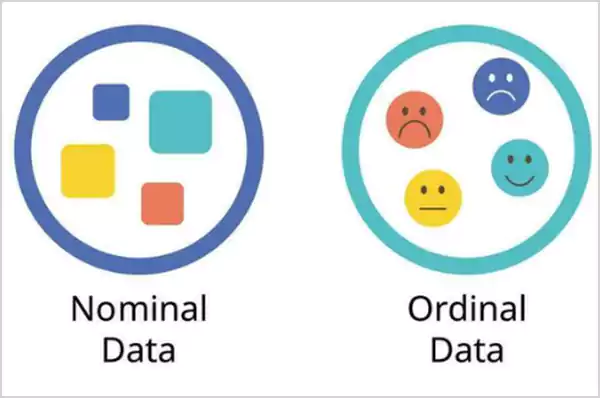
Qualitative data can be classified into two broad categories: Nominal and Ordinal Data. The categorization of the data is based on how it is used and understood by researchers.
Nominal Data
Nominal data is a type of data that does not have a meaningful order or rank; it only includes names or labels. Example: Hair color, like black, brown, blonde, brunette, etc. You cannot allot a rank or order to this type of data; nothing is higher or lower than others.
Ordinal data is any information that can be arranged in an order or rank, but the gaps between each rank are not measurable. Example: Skill levels, like beginner, skilled, average, expert, etc. This data shows ranking, but the gap cannot be measured.
You may also find some sources including binary data as a third type. However, it is just a type of nominal data, which has only two possible values, such as true or false, yes or no, and so on.
Common Qualitative Data Collection Methods

Now that you understand the characteristics of the data, let’s focus on qualitative data analysis methods. The collection process of the study is all about exploring motivations, experiences, and ideas. Here’s how you can collect data for qualitative research:
- Interviews: Conducting one-on-one interviews is one of the oldest and most direct ways to collect information for qualitative studies. A researcher can talk personally, ask questions, and modify the conversation to get better insights.
- Focus Groups: In this method, a small and focused group of 6 to 10 people of a similar background discuss a topic led by a moderator. For example, a group of athletes for a gymwear research project.
- Observation: A researcher observes individuals in their natural environment and records their behavior to collect valuable data.
- Record Keeping: This is a type of archival method that involves utilizing existing data from reports, documents, or journals of an organization.
- Case Studies: In this method, researchers analyze a particular case with the help of interviews, observations, and existing documents.
- Longitudinal Studies: This is a long-term approach to data collection. Data can be collected from a group of people over an extended period, sometimes even years.
How to Do Data Analysis in Qualitative Studies?
After data collection, researchers need to make sense of the information. Here are the usual steps followed by a researcher:
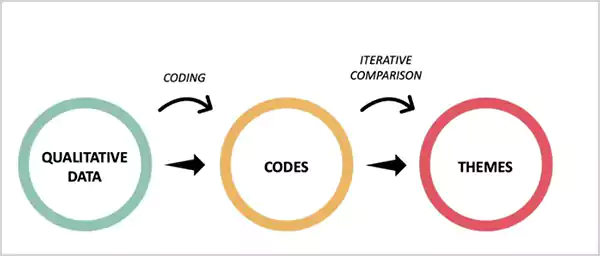
- One of the most important qualitative data analysis techniques used in this step is known as Coding. It involves assigning labels or some kind of codes to make the information more organized.
There are two main kinds of coding methods:
- Deductive analysis: In this case, the analyst starts with a predefined set of codes or ideas, which are often based on earlier research.
- Inductive analysis: There is no fixed framework in this approach, and the analyst allows patterns or themes to come up naturally from the information.
Coding powers business insights, as it makes it easier to find trends and draw conclusions. Porter’s Five Forces, or SWOT analysis, are some other popular techniques to analyze qualitative research with a structured approach.
- After organizing and coding the data, it is time to check your data for consistency and accuracy.
- The last step in the process is to conclude and report your findings. Summarize all insights, mention important notes, show key takeaways in a structured report, and highlight how this data can be useful for the organization.
To support the process, analysts also make use of various helpful qualitative data tools. You can check out useful tools like MAXQDA, ATLAS.ti, Quirkos, Taguette, MonkeyLearn, Qualtrics, and others.
What are the Pros and Cons of Qualitative Data?
Like every other thing in this universe, executing data analysis in qualitative research has its own advantages and disadvantages. I will give you a brief look at its pros and cons so that you can decide whether it fits your research type and resources.
Pros
- It offers a comprehensive understanding of people’s behavior and thoughts.
- Open-ended questions often reveal richer data.
- It helps businesses and researchers to understand the motivation behind people’s actions.
- It is more economical when compared to other types of data analysis.
Cons
- Collection and analysis can be time-consuming.
- Results from small groups may not provide the larger picture.
- The quality of the analysis depends on the skills and interpretations of the researcher.
- It is more difficult to analyze a qualitative study.
Tips for Effectively Analyzing Qualitative Data
Before we wrap up this topic, here are some of the best practices you should follow to effectively analyze qualitative research:
- Start by setting clear goals and understanding what you want to learn before collecting data.
- Depending on your research goals, select the right qualitative data analysis method for collection.
- Make sure you include diverse participants to get balanced and fair insights.
- Stay away from your personal opinions, biases, or assumptions.
- Use multiple sources to validate data and observations for better accuracy.
Furthermore, while conducting research, never forget to factor in participants’ backgrounds and research settings while interpreting outcomes.
Final Words
Qualitative data analysis offers deep insights into human experiences and social behavior. It can add value to your research by giving you insights about emotion, reasoning, and real-world context.
This type of data is crucial for creating meaningful solutions and making informed decisions. Whether you are conducting an academic study or marketing research, it allows you to form a better understanding of people and their decisions.
Frequently Asked Questions
What is an example of qualitative data?
Which is quantitative data?
Any piece of information that can be counted or measured in numbers or numerical values is considered quantitative data.
What is qualitative vs quantitative data?
Qualitative deals with the descriptive and non-numeric part of the information. On the other hand, quantitative data is numerical and measurable in nature.
How is qualitative research used in different fields?
It is mostly used across industries to understand the experiences, motivations, behavior, and opinions of people to come up with better solutions and strategies.
What are the 2 types of quantitative data?
There are two broad types of quantitative data, i.e., Discrete and Continuous data.
How do you collect qualitative data?
Interviews, focus groups, observation, record keeping, and case studies are some of the most common collection methods.

Related Posts

How to Check for Malware on Mac in 2026?
Can Mac computers get viruses? Macs are not as safe as people think. Yes, macOS has built-in tools like XProtect…
10 Best Lightroom Preset Alternatives in 2026
“Photography is the story I fail to put into words.” — Destin Sparks (Landscape Photographer) For years, Lightroom presets have…
Elementor Hosting vs SiteGround: Which is Faster in 2026?
A website’s performance is mainly determined by its Speed. Even a slight delay can reduce conversions by a significant margin.…
10 Best Visual UGC Platforms for eCommerce Brands in 2026
“People influence people. Nothing influences people more than a recommendation from a trusted friend.” — Mark Zuckerberg (Meta CEO) That…

The Data Models Powering the Next Creative Revolution in Video Generation
Artificial intelligence has evolved from a mere tool to the cornerstone of advancements in the new era. Over the years,…
Solar Software Companies: How Platforms Improve Cross Team Collaboration
“If everyone is moving forward together, then success takes care of itself.” — Henry Ford (Industrialist & Business Magnate) Handoffs…

What Healthcare Leaders Expect From Digital Tools
Healthcare executives are under pressure to protect patient safety, clinician time, and data privacy while modernizing the delivery of care.…

How to Reset Android Phone When Locked? (Safe Factory Reset Methods)
Locked out of your Android phone or stuck on the screen? It happens more than you think. A forgotten PIN,…
How to Transfer Contacts from Android to iPhone: 4 Easy Methods
Switching from Android to iPhone should not feel like rebuilding your life from scratch. Restoring contacts on iPhone should be…