The story behind every app interaction is waiting to be discovered under the layers of data. Mobile analytics platforms serve as your friendly translator of that story.
They reveal beyond the basic download numbers to show you the human behavior happening within your app, and they help you understand where users feel engaged, confused, or genuinely delighted.
It’s not purely about data; it’s about arming you with empathy for your audience, suggestions to change subtle cues into real developments, and unlocking true growth
Well, that’s not it; this concept is way bigger and impactful than you think. That’s why in this blog post, we are going to explore the spectrum of analytics in detail, giving valuable insights to the readers.
Let’s begin!
Key Takeaways
Understanding why mobile app analytics are your competitive edge
Decoding the hidden goldmine in user behavior data
Looking at the top apps that use analytics to dominate
Discovering some essential metrics that actually move the needle
Uncovering the analytics implementation strategy
Why Mobile App Analytics Are Your Competitive Edge
Let me ask you a question…
Did you know that 77% of app users churn within just 3 days of installing your app? And after 30 days, you have a retention rate of just 5.6%.
Out of 1,000 downloads, only 56 people will still use your app after a month.
A mobile app analytics platform gives you a unique insight into your app’s inner workings. You can see:
Which features users love (and which they ignore)
Where users become frustrated and leave
What steps lead to conversions
How do different user groups behave
It’s like having a window into the soul of your app.
Interesting Facts Analytics provide insights into user behavior, helping companies make data-driven decisions about app development and marketing strategies. (Source)
The Hidden Goldmine in User Behavior Data
Let me let you in on a little secret…
The real treasure isn’t just about racking up downloads. It’s all about getting to know your current users and making their experience even better. The companies that master user behavior data can drastically improve their retention rates.
For example, apps that leverage personalized messaging achieve retention rates of 61-74% vs. a 49% rate for generic campaigns. That’s a 25-35% difference that adds up to big dollars.
Here’s why this is crucial:
User behavior data shows you the hidden patterns in your app. You can pinpoint what actions cause users to quit during onboarding, what features keep them coming back, and exactly when they’re most likely to buy something.
And it gets even better…
Armed with this data, you can predict future behavior and prevent churn before it happens.
How Top Apps Use Analytics to Dominate
The most successful apps don’t just collect data. They take action on it.
I’m going to show you exactly how they do that…
Real-Time Decision Making
Successful apps track user behavior in real-time. This allows them to react immediately if they spot issues. No more waiting for weekly or monthly reports and trying to figure out what went wrong.
Personalized User Experiences
The best apps don’t treat all users the same. They use analytics to create personalized experiences. Based on the behavior of the user, they display different content, features, and messages.
Optimized User Journeys
Smart app developers use analytics to map out the perfect journey through their app. They identify the shortest path from download to conversion and help users follow that path.
Predictive Analytics
The top analytics platforms use artificial intelligence to predict user behavior. You can identify users who are likely to churn before they leave and take action to re-engage them.
Essential Metrics That Actually Move the Needle
There are countless metrics you can track, but not all of them matter. Focus on the ones that will drive your app to success.
User Retention Rate
This is the big one. A day-one retention rate of around 25% is considered average. But top-performing apps achieve much higher rates by understanding and optimizing the user experience.
Session Length and Frequency
How much time do users hang out in your app? How frequently do they come back? These stats give you a peek into how fun and engaging your app really is.
Conversion Funnels
A conversion funnel tracks users from their first action to their ultimate goal. Where do they get stuck? What can you optimize?
User Lifetime Value
This metric tells you how much revenue each user will generate over their lifetime. It’s essential for understanding your app’s true profitability.
The Analytics Implementation Strategy
Alright, now you know why analytics are essential and what you should track. But how do you start using analytics to grow your app?
Here’s a step-by-step plan…
Start With Clear Goals
Before you jump into data, you need to know your objectives. What do you want to achieve with analytics? Are you trying to improve retention? Increase in-app purchases? Reduce churn?
Your goals determine which metrics you should focus on.
Choose the Right Platform
Not all analytics platforms are created equal. When selecting one, make sure it offers:
Real-time data processing
User segmentation
Conversion tracking
Predictive analytics
Set Up Proper Event Tracking
Choose which user actions you want to track and make sure you track them correctly. This includes:
User registration and onboarding completion
Feature usage and engagement
Purchase behavior and conversions
App crashes and technical issues
Create Actionable Dashboards
Raw data is useless without context. Create dashboards that show:
Key performance indicators (KPIs) at a glance
Trends over time
Comparisons between user segments
Alerts for critical events or issues
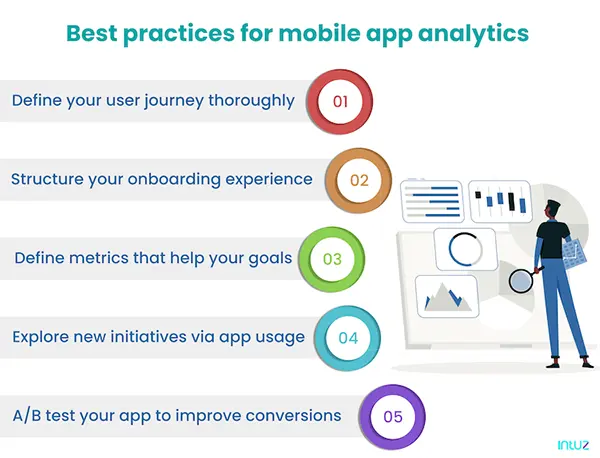
iguing Insights
This infographic shows the best practices of mobile analytics
Making Data-Driven Improvements
Now comes the fun part…
With good analytics in place, you can start making improvements based on actual user behavior rather than gut feeling or guesswork.
Test everything. Before rolling out changes to all users, validate them with A/B tests.
Prioritize high-impact areas. If 50% of users drop off during onboarding, that’s where you start. Fix the biggest problems first.
Monitor continuously. Analytics is not a set-and-forget solution. Keep tracking and optimizing.
Apps that use analytics to delight users are the ones that will win in today’s crowded marketplace.
Time to Get Serious
Mobile app analytics is no longer a nice-to-have. It’s a necessity in a world where mobile app revenue is expected to reach $935 billion in 2024.
The apps that will survive and thrive will be the ones that understand their users better than anyone else. They will use analytics to create such delightful experiences that users will be unable to imagine their lives without them.
Your app’s success depends on making smart, data-driven decisions. The question isn’t if you should use analytics.
The question is how fast you can implement them and start gaining the competitive edge they provide.
The data is waiting for you.
Start collecting it, analyzing it, and acting on it. Your users (and your bank account) will thank you for it.
Frequently Asked Questions
What is mobile app analytics?
They are the set of tools and metrics that help to study the varied range of campaigns to get the maximum amount of business growth and user engagement.
What are the 5 V’s of big data?
It includes componential factors like Velocity, Variety, Varsity, Volume, and Value.
What are the limitations of mobile apps?
Limitations of mobile apps include privacy and security risks, high development and maintenance costs, the need for frequent updates, potential compatibility issues across devices and platforms. They also rely on app stores for distribution, limited offline functionality, and the risk of slow performance from numerous background apps.