It is a process of checking and learning about the health of a data system and pipelines.
What is Data Observability? Top 5 Data Observability Tools for 2026
Updated on: Mar 13, 2026
Data has become the biggest asset for any business today. Be it using customer insights and marketing performance to improve in the competitive market, or financial forecasting and automation.
But with more complex data systems. Even a small issue like missing records, broken pipelines, or inaccurate dashboards can result in costly mistakes. A Gartner report states that poor data quality costs organizations an average of $12.9 million annually, highlighting the need for reliable data monitoring. Now that’s huge! And this is where data observability steps in.
It helps businesses detect, diagnose, and resolve data issues before they impact operations. By providing visibility into the health of data pipelines and systems, observability tools enable organizations to maintain accuracy, consistency, and trust in their data infrastructure. Many businesses now rely on the best observability platform solutions to maintain operational efficiency and data reliability across growing ecosystems.
Key Takeaways
- Data observability aids in the tracking of data systems and data pipelines’ health.
- It helps ensure data reliability by identifying problems as they arise.
- Freshness, volume, schema, lineage, and quality are the key components
- Observability tools are essential for modern businesses to minimize downtime and enhance the accuracy of analytics.
- The platform that’s chosen might depend on the scalability, integrations, and needs for monitoring.
- Modern observability solutions support businesses with greater scalabilityas data environments continue to expand.
What Is Data Observability
Data observability is the ability to track, crack, and gain insights into the health of data within and between systems, pipelines, and platforms. It detected real-time data issues like missing data, unexpected changes, delayed updates, or broken workflows.
Gather observability tools to continuously monitor data environments rather than manually check datasets or wait for reports to fail. Modern systems are continuously evolving with platforms like Netdata, helping businesses monitor infrastructure and real-time performance alongside data reliability metrics. Some advanced platforms also support query languages like PromQL for deeper monitoring and analytics capabilities.
To appreciate its advantages, let’s first take a look at why data observability is so vital for contemporary companies.
Why data observability matters:
- Identifies data problems early on
- Improves data accuracy
- Minimizes time interruptions in pipelines
- Establishes a relationship based on trust and around analytics
- Supports faster decision-making
- Helps maintain compliance
Since more businesses are shifting to cloud-based, AI-driven, and real-time analytics, data observability has become an important factor for ensuring reliability.
DO YOU KNOW?
Data observability was initially derived from DevOps and cloud infrastructure monitoring techniques involving software observability, before being applied to today’s data systems. Many modern monitoring dashboards and visualization tools, including Canvas interfaces, now help teams simplify complex observability workflows.
Key Components of Data Observability
Data observability is the process of tracking various factors of data systems to maintain the accuracy and usability of data. There are a few key elements that can assist organizations in monitoring data health.
- Freshness: Freshness is a measure of whether or not the data is up-to-date. Delayed data can impact dashboards, reports, and business decisions.
- Volume: This component keeps a record of whether the amount of data expected is being processed. Significant peaks or valleys can be signs of pipeline issues.
- Schema: Schema monitoring identifies changes to a dataset, such as a changed dataset name, renamed column, or column format.
- Lineage: Data lineage indicates the movement of data and where it is being transformed. This enables teams to easily pinpoint problem causes.
- Quality: Duplicate records, missing values, inconsistencies, and inaccurate facts are identified and checked for quality.
These elements provide organizations with a full view of their data infrastructure.
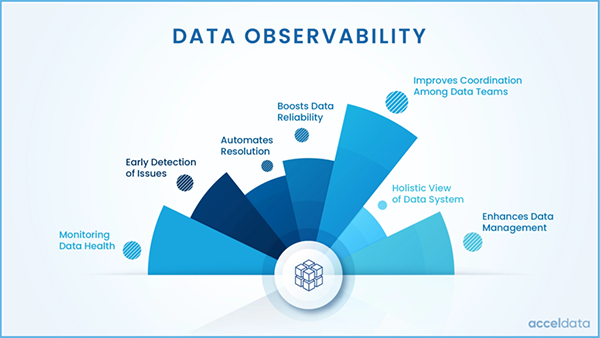
How Data Observability Improves Data Reliability
Accurate reporting, analytics, and automation rely on reliable data. Businesses have the ability to remain reliable with data observability by identifying issues before they impact operations.
Organizations can proactively detect and resolve issues during their lifetime instead of responding to the failures once they are completed.
Data observability offers several benefits, including faster issue detection, reduced operational downtime, improved analytics accuracy, improved teamwork between teams, and greater trust in the business.
For instance, when a sales pipeline fails to update on a sales dashboard, an observability platform can notify teams immediately, so that wrong choices are not made. It also eases the strain on engineering teams by automating processes like monitoring and troubleshooting.
Top 5 Data Observability Tools to Consider
Observability space has several leading data platforms that have come into being as the need for reliable data systems increases. Below are five tools commonly used in 2026 that businesses should consider.
1. Monte Carlo
One of the most well-known data observability platforms is Monte Carlo. It provides automated anomaly detection, data lineage tracking and real-time failure alerts for pipelines.
Key Features:
- End-to end data monitoring
- AI-powered anomaly detection
- Web-based root cause analysis (RCA) system
- The automated addition of cloud services
- Good integration with the cloud
It is especially favored by businesses that handle extensive data operations.
2. Datadog
Datadog is best known for its infrastructure monitoring, and it offers robust observability solutions for data systems as well. Businesses need to familiarize themselves with the wider monitoring environment prior to selecting Datadog.
Key Features:
- Real-time monitoring dashboards
- Cloud infrastructure visibility
- Log management
- Automated alerts and analytics
Datadog is suitable for companies that are looking for an angle solution that can handle system monitoring as well as data monitoring.
3. Bigeye
Bigeye is based on proactive data quality monitoring and anomaly detection. It promises trust within a company’s analytics and reporting.
Key Features
- Automated data quality checks
- Custom monitoring metrics
- Data anomaly alerts
- Easy integration with warehouses
Its intuitive design caters to the growing business and data teams.
4. Acceldata
Acceldaya offers enterprise-class observability solutions for complex, large-scale data environments.
Key Features
- Pipeline performance monitoring
- Data reliability analytics
- Infrastructure observability
- AI-driven issue detection.
It is used across organizations with large amounts of data in the cloud and hybrid environments.
5. Sifflet
Sifflet is designed to be both of these, allowing teams to quickly dig into and solve data problems.
Key Features:
- End-to-end data monitoring
- Data lineage visualization
- Collaborative incident management
- Real-time alerts
Sifflet is becoming a preferred product for organizations that value transparency and collaboration around their data.
Features to Look for in Data Observability Platforms
Not all obsrvability tools offer the same capabilities. A business needs to carefully consider the features based on the infrastructure, the scalability requirements and the complexity of the data.
When choosing a platform, it is crucial to pay attention to the following features.
- Real time monitoring
- Automated anomaly detection
- Data lineage tracking
- Customizable alerts
- Cloud platform integration
- Dashboard visualization
- Scalability for big data
- AI-powered insights
Ease of use, coat and customer support are also important factors to keep in mind when choosing an organization. Selecting the right platform can help enhance the efficiency of the operations and minimize the risk of data loss, which can be expensive.
Conclusion
Data-driven decision-making is important for businesses today as they are increasingly concerned with the reliability and accuracy of their data systems. An organization can monitor pipeline health, identify anomalies, and troubleshoot problems before they cause disruption to operations or analytics with data observability.
The adoption of cloud computing, AI, and real-time analytics is making observability platforms an integral part of modern data infrastructure. Numerical tools such as Monte Carlo, Datadog, and Bigeye give businesses more visibility and control over their data environments. The major takeaway is that organizations can enhance reliability, minimize downtime, and foster trust in their data systems by investing in the right observability solution.
Frequently Asked Questions
What do you mean by data observability?
Why is data observability important?
It aids businesses in identifying and addressing data challenges prior to the impact functions.
What are some industries that rely on data observability tools?
Many industries, such as finance, healthcare, retail, and technology, rely on them.
What are the differences among data observability, data monitoring, and data security?
Yes, observability gives you more insights into the why of problems, not alerts.

Related Posts

8 Best AI Presentation Makers for Business-Ready Slides
Making a presentation doesn’t just mean designing slides. It’s about defining a clear structure, using defined logic, useful visuals, and…

Queue Management Software Troubleshooting Guide: 8 Common Faults and Fixes
The long wait times and ineffective management of customer queues can have a significant impact on customer satisfaction and business…

How to Use Similarweb Website Traffic Data for Competitor Research
Competitor research without traffic data is guesswork. You can guess who your rivals are, guess how big they are, guess…
Choosing the Right Hosting Model for Scalable Digital Platforms
The performance of digital business is directly related to website speed, uptime, and scalability. Slow page performance has a negative…

How Data-Driven Performance Tools Are Transforming Employee Recognition in Tech Companies
“People work for money but go the extra mile for recognition, praise, and rewards.” — Dale Carnegie (Writer & Teacher)…

Why Businesses Struggle to Collect Reliable Data from the Web
Almost every company that depends on data runs into the same problem: although they can find the data they need,…

Why Financial Data Recovery Matters for Businesses
Financial data supports every part of a business, directly affecting cash flow, payroll, tax reports, audits, customer billing, and daily…

CMMC Compliance Is Coming for Manufacturers. Here Is What You Need to Do
“Cybersecurity is much more than a matter of IT.” — Stephane Nappo (Cybersecurity Professional) For manufacturers working within the defense…

How Data-Based Tools Influence Learning Performance
Learning has transformed in the modern age with the integration of new technologies to help students and professionals prosper in…