It comprises the data gathered behind the scenes, including user behavior, traffic origin, and system performance.
How to Read Backend Data Insights to Scale Any Website in 2026
Updated on: Feb 26, 2026
Someone lands on your website. Waiting, and waiting.
They wait, and wait, and then they leave.
You will never see them again.
It occurs more often than most teams would imagine. Indeed, Reboot statistics reports recorded that 47% of people drift away from a website taking longer than 3 seconds to open. You lose almost half your prospective audience before they even get to look at what you have to offer.
However, this is the actual problem: a majority of these drop-offs cannot be seen on the surface.
Your homepage may be alright. Your design may be smooth. But down here, your back-end data is telling a very different tale-one of friction points, opportunities that were missed, and growth signals that were overlooked.
Scaling a website in 2026 does not revolve around design or content. It is all about reading what your data is attempting to convey to you and doing it quickly.
Let us unravel the actual working process of backend data insights and how you can apply them to become smarter.
Key Takeaways
- Almost half of the users abandon slow websites in 3 seconds.
- Real user behavior and performance problems are known through the backend data.
- Measures such as traffic, conversions, and behavior lead to decisions.
- The interpretation of data is the key to significant improvements.
- The analytics of the future will be dependent on AI and automation.
Understanding the Basics of Backend Data Analytics
Backend data analytics concentrates on all the actions that occur behind your site. Whereas users work with what they view at the front end, backend systems monitor: How users arrive, what they click, where they drop off, and how long they stay.
This information is gathered using servers, databases, and analytical software, which provide you with an in-depth view of the user behavior. It is not only about gathering numbers but transforming those numbers into growing decisions that will enhance performance and growth.
Key Metrics: Traffic, Conversions, and User Behavior
There are metrics that have a direct impact on growth; these key metrics are:
- Traffic: It demonstrates the number of people visiting your site and their sources (search, social, direct, etc.)
- Conversions: The steps that you want the users to follow are purchases, sign-ups, and downloads.
- User Behavior: This includes time spent on pages, click patterns, and bounce rates.
A combination of these metrics will give you an idea of the number of users you have and also what exactly they are doing.
Difference Between Frontend and Backend Data
User interface data is what is viewed by the visitors: design, layout, and content.
You read backend data: Performance, interactions, and system behavior.
Consider it to be thus:
Frontend = Experience
Backend = Insight
You may have a beautiful site, but you are playing a guessing game unless you understand what goes on in the background.
DO YOU KNOW?
Even a 1-second decrease in the amount of time it takes to load a page can minimize conversions by 20 percent. Speed is not only technical, but financial.
Essential Tools to Access and Analyze Backend Data
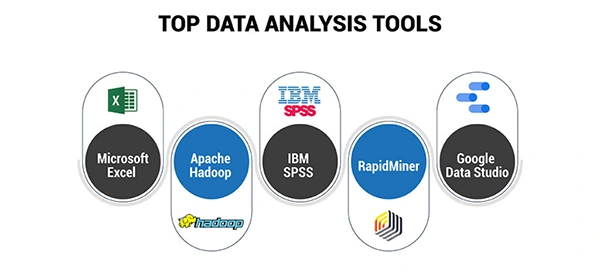
You require the appropriate tools so that you can make sense of the data on the back-end. Popular categories include:
- Analytics Platforms: Monitor traffic, behavior, and conversions in real time.
- Heatmap Tools: Highlight the most popular user actions (where people move, scroll, and interact)
- Performance Monitoring Tools: Time loading measures, server response, and technical problems.
- Business Intelligence Dashboards: Integrate two or more sources of data.
It is not about utilizing all the tools, but about the correct combination to provide you with clear and actionable insights.
How to Interpret Data for Better Decision-Making
Data without interpretation is just noise. Some good questions to ask are:
- What is causing users to abandon this page?
- What is the most effective source of traffic?
- What are the bottlenecks among users?
For example, Low conversions + high traffic, then there is a problem with the messaging. The low traffic and high conversions = Scaling opportunity.
Poor user experience = High bounce rate.
This is where the backend development services usually come into play, as they assist businesses in organizing their data correctly, monitoring significant events, and creating systems that contribute to more intelligent analysis.
The goal is simple: Transform knowledge into practice.
Using Data Insights to Improve Website Performance
After knowing your data, you can then use it to enhance performance. This is why data can be turned into action:
- Speed Optimization: In case of high load times, optimize images, scripts, and hosting.
- Conversion Optimization: Unless users are converting, optimize CTAs, designs, or text.
- User Experience Improvements: In case users lose their way on some of the points, make it easier to navigate or less frictional.
- A/B Testing: Test different variations of pages to determine what works.
Minor adjustments that are supported by data can result in major changes in the long run.
Future Trends in Website Analytics and Data Intelligence
The future of backend data analytics is becoming smarter and automated. Key trends include:
- AI-Powered Insights: The tools do not simply present data but elucidate it and recommend actions.
- Predictive Analytics: Forecast user behavior before it happens.
- Real-Time Personalization: Change the web page in real-time according to visitor behavior.
- Privacy-Focused Analytics: Removing data collection and user privacy laws.
The competitive edge will belong to those who utilize data in the most intelligent way in 2026, not the most data-intensive business.
Conclusion
The backend data helps bring out the real story of your site. It presents what users do not mention, what designs cannot show, and what assumptions are frequently overlooked. It is your best growth tool when applied right: it will enable you to optimize performance, enhance user experience, and grow with confidence.
Eventually, it is not about guessing to create successful websites. They are constructed through insights.
Frequently Asked Questions
What is backed information on a website?
What is the significance of backend data?
It assists companies with a comprehensive view of the way users interact with their site and the need to improve in some areas.
What are the tools of the backend analytics?
BI dashboards, heatmaps, performance monitoring tools, and analytics platforms.
What can data do to enhance the performance of websites?
By spotting such problems as low speed, inadequate UX, or low conversions, and addressing them in a strategic manner.
Does it have technical data analytics of the backend?
It may be, and there are numerous tools that make it easier and allow the insights to be made available and used by non-technical users.

Related Posts

8 Best AI Presentation Makers for Business-Ready Slides
Making a presentation doesn’t just mean designing slides. It’s about defining a clear structure, using defined logic, useful visuals, and…

Queue Management Software Troubleshooting Guide: 8 Common Faults and Fixes
The long wait times and ineffective management of customer queues can have a significant impact on customer satisfaction and business…

How to Use Similarweb Website Traffic Data for Competitor Research
Competitor research without traffic data is guesswork. You can guess who your rivals are, guess how big they are, guess…
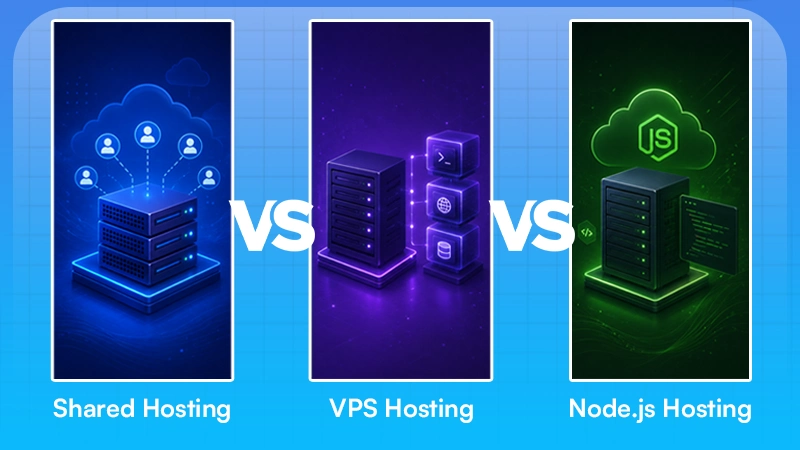
Choosing the Right Hosting Model for Scalable Digital Platforms
The performance of digital business is directly related to website speed, uptime, and scalability. Slow page performance has a negative…

How Data-Driven Performance Tools Are Transforming Employee Recognition in Tech Companies
“People work for money but go the extra mile for recognition, praise, and rewards.” — Dale Carnegie (Writer & Teacher)…

Why Businesses Struggle to Collect Reliable Data from the Web
Almost every company that depends on data runs into the same problem: although they can find the data they need,…

Why Financial Data Recovery Matters for Businesses
Financial data supports every part of a business, directly affecting cash flow, payroll, tax reports, audits, customer billing, and daily…

CMMC Compliance Is Coming for Manufacturers. Here Is What You Need to Do
“Cybersecurity is much more than a matter of IT.” — Stephane Nappo (Cybersecurity Professional) For manufacturers working within the defense…

How Data-Based Tools Influence Learning Performance
Learning has transformed in the modern age with the integration of new technologies to help students and professionals prosper in…