


It is advised to keep in mind that directors of a board aren’t technical specialists and hence do not understand numbers. So anywhere between four and six metrics is enough because if there are any more than that, the members will get confused.
Data Loss Incident Metrics for the Board: Translating Technical Data into Business Risk
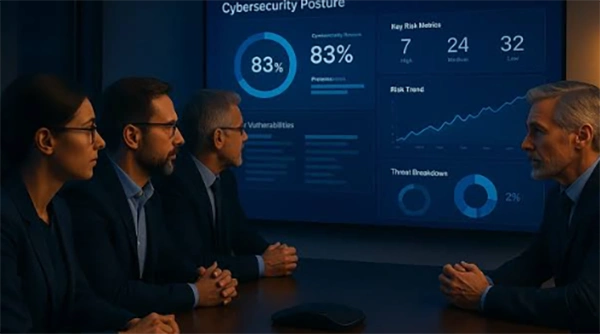
The slide said mean time to respond had improved. Three directors nodded.
The CISO meant time to first containment action. The head of infrastructure was thinking of full service restoration. One director assumed it meant the incident was closed and the data was back. Nobody asked, because the number had gone down, and down is good.
That meeting produced agreement without understanding — the most expensive outcome in board reporting, because it looks like success. This piece covers which incident metrics survive translation from the SOC to the boardroom, which ones should never make the trip, and how to define them so the room is discussing the same thing.
At a Glance
- Why SOC Dashboards Don’t Survive the Boardroom
- The Definition Problem That Comes First
- Four Numbers That Translate
- The Translation Layer
- What Doesn’t Belong in the Board Pack
- The Governance Floor
- Wrapping Up
- FAQs
Why SOC Dashboards Don’t Survive the Boardroom
The reason most Security Operational Centres fail isn’t due to the fact that the data inside them is wrong; they fail because people inside the boardroom aren’t used to most technical terms that are displayed in the SOC and hence interpret their meanings in a completely wrong way.
See, the dashboard reflects figures and data through charts or graphs and measures the entire performance of a process with metrics like queue depth, alert quality, and analyst throughput. Now these might be useful internally, but they still remain completely irrelevant to the board members because they aren’t asking how efficient a process is. They’re asking how exposed their organization was, and what the time duration and costs incurred for this exposure. Almost none of that is answered by a chart of alert volume.
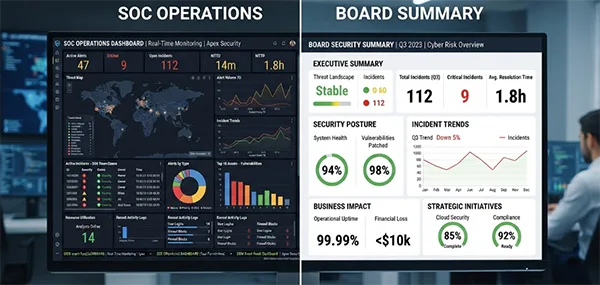
To solve this problem, you need to understand that the ones creating the SOC are specialists who understand numbers, but the people it needs to be explained to, which are the directors, are generalists who understand real-world insights and choices rather than numbers. So to tackle this, fewer numbers should be reflected, but each of them should carry a decision or an answer to an important question.
The Definition Problem That Comes First
It is extremely essential for an organization to lay out what its pre-existing metrics are before they ever choose a different set of them. This step is underrated and hence is important for everything to go smoothly.
“MTTR” is four metrics wearing one label.
In security operations, the R can stand for a variety of terms like resolve, recover, or repair. All of this depends on who’s speaking and reporting an MTTR figure in the board meeting; not specifying the meaning of R can cause confusion throughout, which can lead to wrong decisions being made.
Where the clock starts and stops
Even the same metrics, when used for different purposes, generate quite distinct results. So it is highly crucial to ask yourself two questions before using a time-based metric.
- Is mean time calculated from the moment of intrusion, at the first malicious action, or at the first noticed indicator?
- Does ‘detected’ mean that an alert was issued or that an analyst actually validated it?
Just like metrics, Containment also doesn’t have a universal definition, which makes it easy to misunderstand its meaning. To identify whether containment in a specific SOC refers to the cutoff of the affected computer from the entire network, shutting down malicious IPs, or eviction of the attacker’s computer is hard and makes room for mistakes.
Even if a universal definition were finalized, calculating the exact time of containment is a technical nightmare because telemetry is fragmented. In this, security data lives in tools across SIEM, endpoint, identity, and email systems that do not align with each other. So Mean-time calculations inherit that mess unless the pipeline is centralized first.
Four Numbers That Translate
There are exactly four metrics that are required for any business meaning to be translated without a director having to learn security operations.
Dwell time
This is considered one of the strongest board-level metrics, because it compresses incident reality into a number all board members easily understand, which is: how long was an attacker present before containment? It overlaps with detection and containment timings, but its virtue is interpretability. When dwell time falls, exposure falls, and no translation is required.
Time to contain
Detection speed matters, but containment is where loss stops accumulating. It answers the question a board actually has after “when did we know” — namely, how long the bleeding continued afterward.
Recovery time against the stated objective
Recovery time in isolation means little. Recovery time measured against the recovery time objective the business already agreed to is a commitment kept or missed, which is a language boards are fluent in.
Recurring incident rate
The one that reveals whether remediation is real. Repeat incidents from the same root cause point to persistent vulnerabilities, incomplete fixes, or controls that aren’t being enforced. It’s also the metric that justifies engineering time for prevention rather than more response capacity.
The Translation Layer
| Technical metric | The question it answers for the board |
|---|---|
| Dwell time | How long were we exposed before we knew? |
| Time to contain | Once we knew, how quickly did we stop the spread? |
| Recovery vs. RTO | Did we restore inside the window we committed to? |
| Recurring incident rate | Are we fixing causes, or repeatedly treating symptoms? |
Each row pairs a number the SOC already produces with a sentence a director can act on. That pairing is the entire job.
What Doesn’t Belong in the Board Pack
Excluding metrics is harder than including them, because every one of these matters operationally.
- Alert volume. This is a signal-to-noise metric that basically flags all the security alerts. Even though it doesn’t necessarily mean it’s bad, board members automatically assume so because of the growing line depiction.
- False positive rate. Even though this is a very useful metric for an analyst and has genuine KPI value, this cannot be easily understood by non-technical board members and hence is kept off the board pack.
- Escalation rate. This tells a member about their internal health regarding a process, but this works better when used as an operations review rather than in board packs or SOC.
- Raw severity counts without trend. A count of high-severity incidents means nothing without the denominator and the direction of travel.
When a metric has high stakes attached to it, achieving the target number becomes more important than solving an actual performance. Hence, it is advised to regularly check how the metrics are used to calculate the numbers and not just consider the final figure itself. This is done to avoid data manipulation, as board members might want to secure funds and achieve good reviews, for which they might change the underlying meaning of a metric.
The Governance Floor
Some of this is no longer discretionary.
Worth Knowing
The addition of “Govern” as the sixth core function of NIST’s Cybersecurity Framework 2.0 on 26 February 2024 elevates cybersecurity from an IT task to an actual business strategy. This ensures that businesses now take digital risks as equivalent to financial or legal risks. This sixth core function was initially added to sit beside the already existing functions, namely Identify, Protect, Detect, Respond, and Recover, but now it informs how an organization handles the other five functions.
The disclosure regime points the same way. Since December 2023, companies in the US are required to report major cyber breaches and their plan to tackle them under Form 8-K, in which these plans related to cybersecurity are to be reported within 4 business days of realising the attack. Form 10-K also makes sure the plans of an organization related to cyber threats are managed and filed annually. Both obligations assume a board that can already interpret its own incident data — which is difficult if the metrics arriving in the pack were never defined.
Wrapping Up
Four numbers, defined once, reported consistently, each mapped to a question the board is already asking. That’s the whole exercise.
The reflex to add another chart should be resisted. A board pack that grows every quarter is usually compensating for metrics that were never translated properly in the first place, and no amount of additional data fixes a definition problem.
Frequently Asked Questions
What is an average board pack size in reference to metrics?
Is dwell time better than mean time to detect?
For board reporting, generally yes — dwell time expresses total exposure in one figure without requiring the audience to understand detection pipelines.
What should be the time duration for these metrics to be audited?
Metrics should regularly be checked, with gap durations varying between 3-4 months and an out-of-cycle briefing for emergency situations.
What if the numbers get worse after better instrumentation?
That’s common and worth stating explicitly in the pack. Improved detection frequently makes metrics look worse before they look better.
Related Posts

How Email Authentication Fits Into a Layered Cybersecurity Strategy
One convincing email can be sufficient to pose major problems regarding security for a business. An email that appears to…

7 Best Client Intake Software Tools in 2026 for Service Businesses
A client intake form works best for collecting data like names, contact information, and project needs. But what does a…

Top Salesforce Consulting Companies: How to Choose the Right One
Salesforce consulting firm was not something that is too difficult to choose. But nowadays, there are too many options available…

How IT Teams Can Protect Data Across Thousands of Employee Devices
Protecting employees’ data from when they get hired and get their first laptop to the day the laptop finally gets…
Recovering Lost Access: When to File Recovery Claims vs. Starting Over with Established Profiles
ALT: Recovering lost access to a profile IMG SRC: https://www.howtogeek.com/microsoft-excel-ways-to-recover-lost-work/ Losing access to an old online profile can be frustrating,…
Top 10 Privacy-Preserving Identity Verification Providers
Choosing the best identity verification software is a high-stakes decision for any business that verifies customers remotely, identity documents, facial…
5 Data Management Problems That Can Put Personal Injury Cases at Risk
Personal injury cases deal with a lot of information, ranging from medical records and accident reports to insurance documents and…
Building Better Data Safety Habits in a Connected World
Nowadays, there is a lot of data say it in laptops, phones, cloud platforms, messaging tools, and in AI-powered applications.…

The Ransomware Risk You’re Not Monitoring: Your Vendors
Ransomeware used to be random. Attackers sent out mass emails and just waited to see who clicked, but that’s not…